Working with absolute values (like net revenues) can be good indicators, but they only depend on the context. If yesterday’s revenue was $ 1M: was it a good or a bad day? If the daily revenue is usually $ 455k, it was a pretty good one. On the opposite, if usually the revenue is around $ 3M, we definitely missed something yesterday!
Knowing that, a good solution would be to manipulate relative numbers: yesterday’s revenue divided by the day before, or even better, yesterday’s revenue divided by an average of N previous days.
Script
It can be challenging to extract such metrics with a SQL script. This is a suggestion using BigQuery, Standard SQL and analytical functions:
Analytical functions
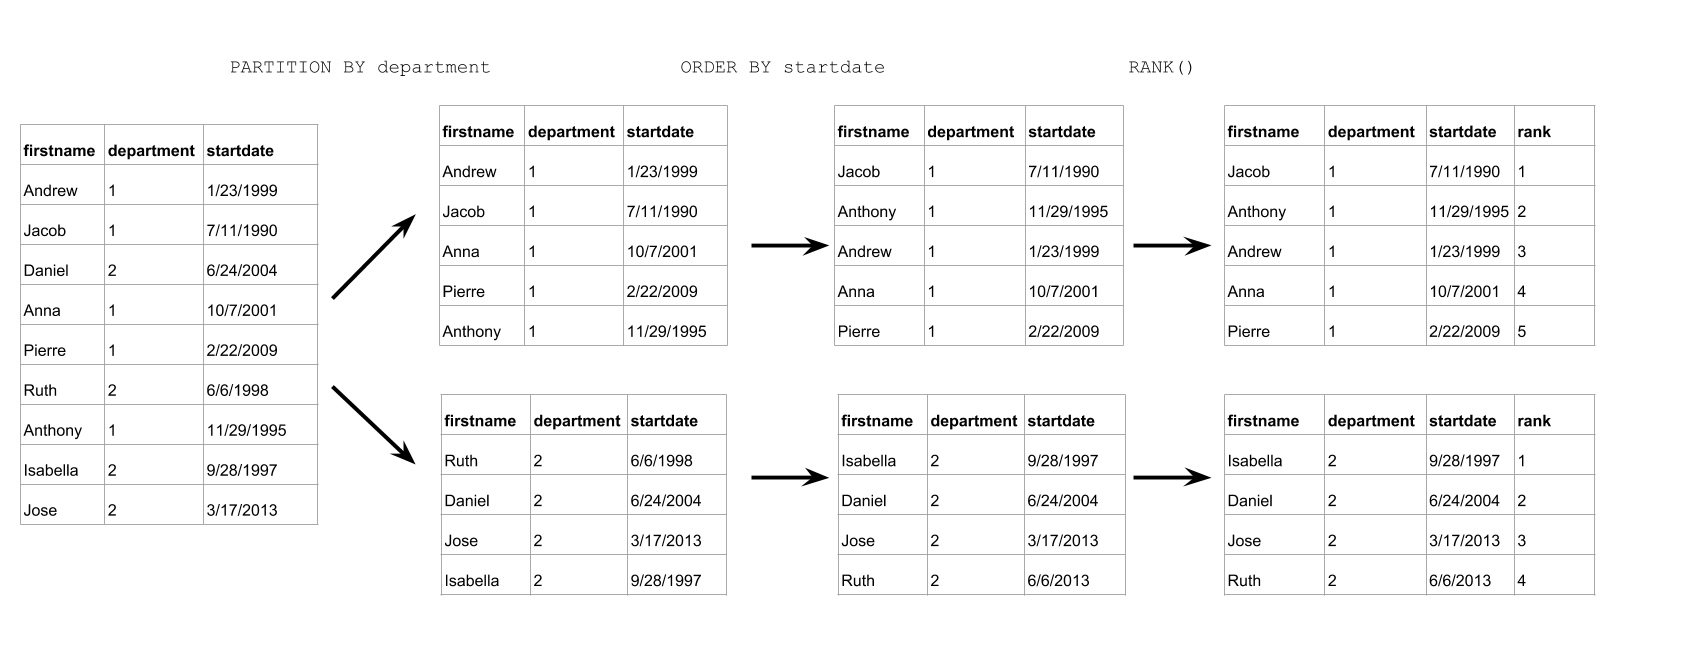
Let’s have a look at what analytical functions are doing:
Usually, we’re using aggregating functions: aggregating functions are based on the whole studied dataset (the one from the FROM clause) and aggregate based on the GROUP BY clause.
Analytical functions are working on the whole dataset and are based on Windows (or partitions). These windows determine buckets (like the 7 previous days in our example), and the analytical function is working on this bucket directly (AVG in our case).
This illustration from BQ documentation will help:
If you want more information, have a look to the BigQuery documentation
–ae